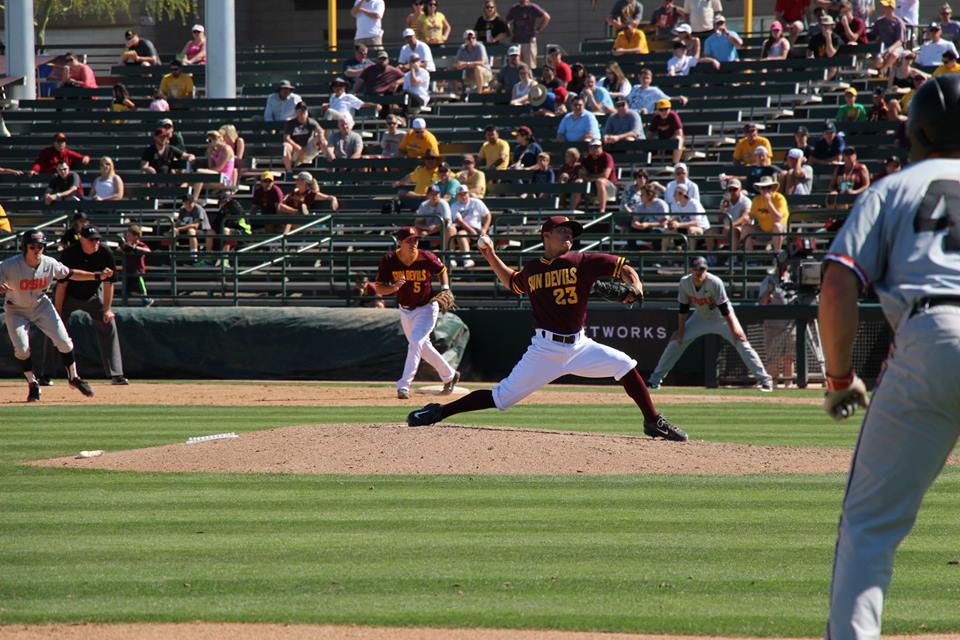
(Photo: Dominic Cotroneo/WCSN)
One of Tracy Smith’s first dilemmas about his team was its lack of an identity. In the first few weeks, the skipper admitted he was still learning the kind of team he had.
There isn’t a doubt now the “Cardiac Devils” have found their angle: close games.
There has been a consistent formula for the Sun Devils that fuels the close games. ASU has a +51 run differential in the first, fifth, eighth, ninth, and extra innings. In the other half of the innings (second, third, fourth, sixth, and seventh) the margin falls to -9.
This helps shed a light on culprit for causing the close games. There’s a distinct lack of offense in the middle of the game with the exception of the fifth inning because of its gaudy +29 run differential–a clear outlier.
Even with the great first and fifth inning numbers, the second and sixth innings haven’t been friendly to ASU. The failure to “shutdown” these innings is a critical part of nailbiting finishes and ultimately contributes to ASU’s 14-5 record in one-run games.
The definition of a shutdown inning is a scoreless half inning that follows a frame in which one’s has team scored. For example, say the Sun Devils score two runs in the bottom of the first inning. Their opponent then scores a run in the top of the second. While they didn’t lose the lead, it’s still a failed shutdown inning by allowing the opponent to cross home.
Tracking shutdown innings isn’t exactly a common practice.
Those who follow the game know its importance, but some will point to a “hold,” which measures a reliever’s reliability in close games, and say that it is a more telling stat than the shutdown innings.
The problem is, shutdown innings aren’t always in close games. For example, when ASU hung nine runs on Purdue in the bottom of the fifth, it stymied the Boilermakers in the next top inning, so credit is given to Eder Erives for the shutdown.
Now for the numbers.
The Sun Devils have had 111 opportunities for a shutdown inning this season, converting them 82 times, for a 74 percent success rate. Due to the fact that there isn’t a benchmark to compare it to in the conference or even the Major Leagues (I calculated everything by hand), we can’t evaluate if that number is in need of improvement or is just right.

What we can look at though is the starters who have had some run support to protect while they are on the mound. We’ll divide the pitchers by the regular starters (Martinez, Kellogg, Lilek) and the bullpen.
| Seth Martinez | 13/18 | 72% |
| Ryan Kellogg | 21/26 | 81% |
| Brett Lilek | 9/13 | 69% |
Kellogg’s success rate is the highest among the starters, even with the most opportunities for a shutdown inning. It’s known that the Canadian lefty gives up a few runs early in games, but he has shown that after his offense gives him some support, he can hunker down and keep runs off the board.
In regards to the non-regular starter, Darin Gillies, his case is impressive in both the bullpen and as a starter. Gillies only made three starts for ASU back in February before he was moved to the bullpen as a middle reliever. In his former role, Gillies was 4-for-5 in shutdown innings–an 80 percent success rate despite a small sample size. However since he found his niche in the bullpen, Gillies is a perfect 6-for-6 in shutdown innings.

The senior is the only reliever with at least six shutdown innings with a perfect mark. As you’ll see in the chart below, Jodan Aboites is also perfect in his four innings.
| Jordan Aboites | 4/4 | 100%* |
| Hever Bueno | 1/7 | 14% |
| Ryan Burr | 8/11 | 73% |
| Eder Erives | 7/9 | 78% |
| Darin Gillies | 6/6^ | 100% |
| David Graybill | 1/1 | 100%* |
| Ryan Hingst | 5/6 | 83% |
| Eli Lingos | 2/3 | 67%* |
| Eric Melbostad | 2/4 | 50%* |
| Grant Schneider | 1/1 | 100%* |
*Denotes not enough qualifying innings
^Denotes bullpen innings only
An alarming find from this research is Hever Bueno’s low success rate. His lone shutdown frame came in the third game of the season against Oklahoma State in the seventh inning. Since then, Bueno is 0-for-5 when the situation presents itself.
Also, for the entire month of March (when ASU only lost three games), the Sun Devils converted 35 out of 42 possible shutdown innings for an 83 percent success rate. Interspersed during that time was a stretch of 16 consecutive shutdowns, starting from UNLV on the 11th through the second game with Oregon on the 21st.
And because we can’t stop there, what about the offense? How do they respond to a failed shutdown inning by the pitching staff?
This might help explain the high volume of close games.
In the half inning following a failed shutdown inning, ASU’s offense has responded with a run of its own 12 of the 25 opportunities it’s had (48 percent). Note that despite a total of 29 failed shutdown innings, four of them have come at home in the top of the ninth with ASU leading, thus no at-bat for the Sun Devils in the bottom of the inning was needed.
Now compare the responding rate to the percentage of one-run games relative to the total number of games. ASU has a 48% response rate, while 51% of its games are one-run games.
Baseball is most definitely a numbers game.
You can reach the writer on twitter @Dom_Cotroneo


You must be logged in to post a comment.